
.gif)
.gif)

Introduction: Why Most Marketing QBRs Miss the Mark
Marketing teams spend weeks pulling campaign data and building Quarterly Business Review (QBR) decks. Then someone presents 30 slides of metrics, stakeholders ask a few questions, and the meeting ends without a meaningful change in direction.
The issue usually isn't missing data. It's the work required to turn that data into a useful assessment of performance.
Now, AI can shorten the reporting and slide-building process, leaving teams more time to interpret results and debate what happens next. With a clear structure and human oversight, the QBR becomes a place to make decisions, not simply revisit the quarter.
1. What Is a Marketing QBR (and why does it matter)?
A marketing Quarterly Business Review (QBR) is a strategic meeting to evaluate the past quarter's results, assess progress against business goals, and agree on priorities for the next quarter.
A performance report records what happened. A QBR examines why it happened and whether the strategy should change.
Say paid acquisition costs increased 15%. A report can show that increase. A QBR should investigate the cause, whether lead quality changed, and whether the channel still warrants its budget.
That's the real purpose of the meeting: connect marketing activity to business outcomes so leadership can make informed decisions.
2. What a great Marketing QBR should actually do
An effective QBR should accomplish four things:
- Align stakeholders on performance. Compare commitments with actual results and company goals.
- Surface useful insights. Explain what changed, where the evidence points, and what remains uncertain.
- Identify opportunities and risks. Show where results could improve or where current investments are exposed.
- Drive decisions. Agree on what to continue, adjust, or stop, with clear owners.
The last point is the test. If the meeting ends without a decision or an explicit reason to maintain course, the team has delivered a report, not a strategic review.
3. The problem with traditional QBRs
Most QBRs follow the organizational chart. Paid media presents its numbers, content reports traffic, and marketing operations reviews the funnel. Each team has useful data, but stakeholders are left to connect the dots.
Preparing those separate sections also takes time. Analysts copy figures into slides, recreate charts, fix layouts, and chase down the latest versions.
Then, next quarter, they do it again, sometimes with different metric definitions or a different deck structure.
The fix is to standardize the questions the QBR needs to answer. A shared narrative framework makes reporting easier to compare and gives AI a more useful starting point.
4. The core structure of an effective QBR deck
A good QBR deck moves from results to implications to decisions. Six sections are enough to tell that story.
Executive Summary
Lead with the quarter's main conclusions, overall performance against goals, and decisions requiring leadership attention. Executives should understand the situation before seeing the detailed evidence.
Performance Overview
Show a focused set of metrics tied to business goals: qualified pipeline, customer acquisition cost (CAC), conversion rates, or campaign ROI, depending on what marketing owns. Compare results against targets and relevant prior periods.
Label each KPI with its target, result, and period of comparison. Define the metric once so sales, finance, and marketing aren't debating what counts halfway through the meeting.
Key Insights
Explain the changes behind the headline numbers. If leads increased while the pipeline stayed flat, investigate lead quality, channel mix, and sales conversion. Distinguish confirmed findings from hypotheses.
Opportunities & Risks
Identify the biggest upside and downside for the coming quarter. Prioritize them by likely business impact, supported by the evidence available.
Recommendations
Propose specific changes and their rationale. A request to increase channel spend should include the expected return, supporting performance data, and the assumptions behind the forecast.
Next Steps
Record decisions, owners, deadlines, and measures of success. These commitments should be the starting point for the next QBR.
Do you want to create a presentation using this outline? Click here.
5. Where AI fits into QBR preparation
AI works best on the repetitive work between collecting information and presenting a clear story.
Given accurate source material, AI tools can:
- Summarize campaign reports and performance commentary.
- Flag trends or unusual movements worth investigating.
- Draft potential explanations and questions for analysts to test.
- Turn a validated outline into draft slide content.
That can reduce time spent assembling the review, but it doesn't remove the need for analysis. AI may identify that conversion rates changed after a campaign launch without proving the launch caused the change.
Use AI to generate a first pass. Let the people responsible for performance verify the numbers, test the interpretations, and stand behind the recommendations.
Do not upload sensitive customer, financial, or employee data into unapproved tools. Use your organization's AI policies and access controls, particularly when reports contain customer-level information.
6. Step-by-Step: Building your QBR deck with AI
Step 1: Gather Data
Pull the relevant data from your analytics, ad platforms, CRM, and marketing automation tools. Include targets, actuals, previous-quarter results, and year-over-year comparisons where useful.
Before using AI, check date ranges, attribution rules, and definitions. If one report counts all leads while another counts only qualified leads, any comparison will be misleading.
Consolidate the verified information into a report or source document.
Ask finance and sales to validate business-facing metrics early. Reconciling pipeline figures during the leadership meeting is a poor use of everyone's time.
Step 2: Use AI to Generate Insights
Give an approved AI tool the data and a specific assignment. Ask it to separate observations from possible explanations and flag missing evidence.
Sample prompt:
"Review this quarterly marketing report against our targets and previous-quarter results. Identify the three changes with the greatest business impact. Separate confirmed observations from hypotheses, note missing evidence, and suggest questions for leadership."
Then review the output with the data owners. A plausible AI explanation is still a hypothesis until the evidence supports it.
Step 3: Create the Narrative
Decide what the quarter means for the business before building slides.
Imagine paid leads increased 22% while qualified pipeline remained flat. The headline is a disconnect between acquisition volume and business contribution. The discussion should explore lead quality, channel economics, and whether budget allocation needs to change.
If several explanations remain plausible, say so. The QBR can propose a test for the next quarter instead of claiming certainty the data cannot support.
Choose the supporting evidence for that story. Keep detailed channel tables in the appendix unless they are needed to make a decision.
Step 4: Draft Slides with AI
Use an AI presentation tool to translate the validated story into a deck.
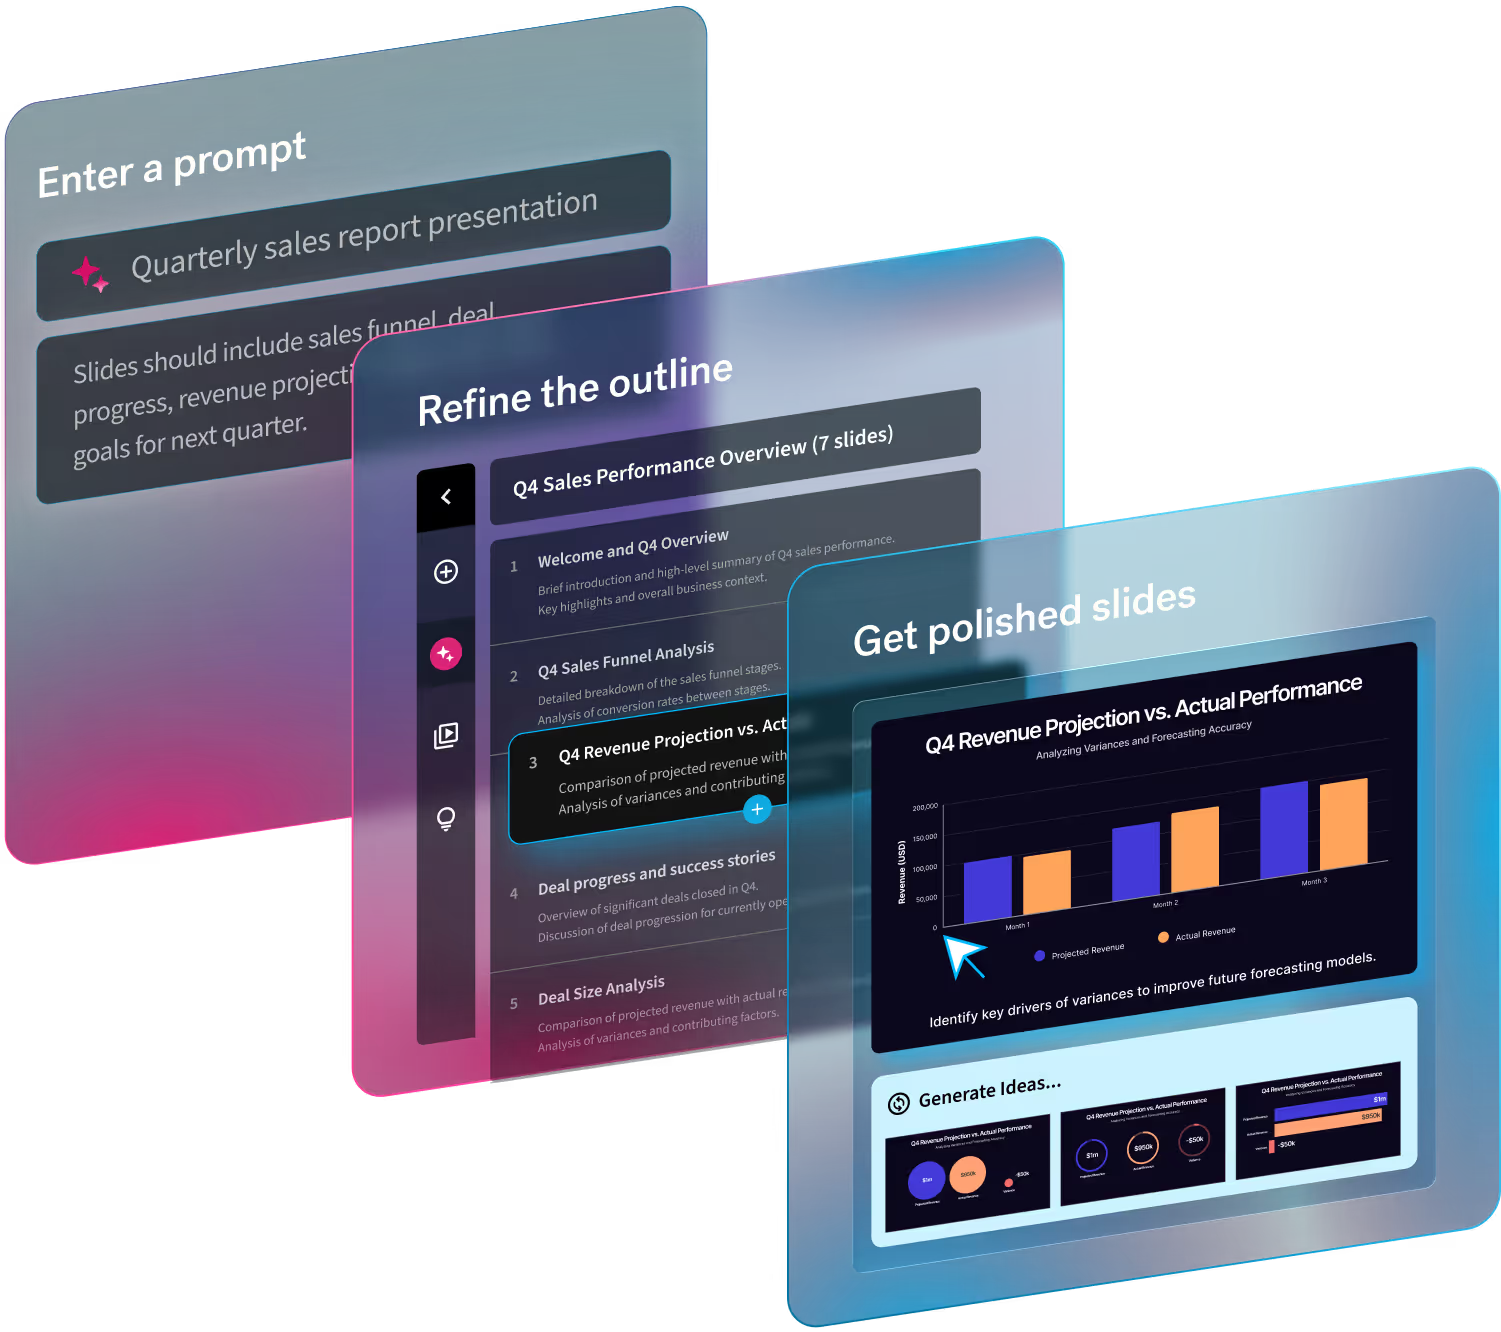
Beautiful.ai's Create with AI Workflow lets you start from a prompt, an outline, or supporting documents. You can review the structure, guide the story, and generate an editable presentation draft.
Include the audience, meeting objective, six-section QBR outline, verified findings, and decisions you want stakeholders to consider.
A useful prompt is: "Build a marketing QBR for executive leadership using the six sections provided. Lead with three verified conclusions, show evidence, and reserve the final slides for decisions and owners." Create a presentation from this prompt.
Beautiful.ai builds the draft with Smart Slides, which automatically handle alignment, spacing, and layout as content changes. You can also revise individual slides or explore different layouts without rebuilding the presentation.
The first draft is a head start, not the final deliverable.
Step 5: Refine and Align
Check every figure against the source, along with the accuracy of any claims or forecasts. Then ask whether the recommendations are realistic and the requested decisions are clear.
Beautiful.ai supports real-time collaboration and slide-level comments, so contributors can review one shared deck. Themes help maintain brand consistency as the team edits.
One person should own the final narrative and sign-off. Shared editing works best when accountability remains clear.
7. Designing slides for clarity
Use slide headlines to communicate conclusions. "Paid acquisition costs rose while qualified pipeline stayed flat" says more than "Paid Marketing Performance."
Choose the visual that best explains the finding: a line chart for a trend, bars for comparison, or a table when exact figures matter. Put the main takeaway first and move supporting detail out of the way.
Beautiful.ai's Smart Slide layouts adjust as text and visuals change. Its data visualization features also support editable charts and tables, including imports or connections to supported data sources.
Put data sources in speaker notes or an appendix so stakeholders can check important numbers without cluttering the slide.
If a stakeholder can't identify the point of a slide in a few seconds, the slide needs another edit.
8. Running the QBR meeting effectively
Send the deck in advance. Use the meeting for interpretation and decisions, not a slide-by-slide reading.
A practical agenda:
- Open with the executive summary and decisions required.
- Review evidence behind the findings that matter most.
- Debate recommendations, trade-offs, and risks.
- Confirm actions, owners, and deadlines.
Encourage challenges to the analysis. What assumptions are weak? Is there another explanation? What would change our recommendation?
Reserve the final ten minutes for commitments. If discussion runs long, move lower-priority questions to follow-up rather than sacrificing the decision-making portion of the meeting.
Capture decisions as they happen. Unresolved questions need owners and follow-up dates, too. The deck guides the discussion; the action plan is the output.
9. Making QBRs repeatable and scalable
A quarterly meeting shouldn't require rebuilding the process four times a year.
Standardize the deck structure, KPI definitions, source reports, approval process, and AI prompts. Keep a record of the questions and decisions from each review so the next one can measure what actually happened.
Beautiful.ai supports reusable presentation templates, shared slide resources, branded themes, and collaboration across teams. For recurring reports, supported data connections can also reduce manual chart updates.
Keep last quarter's decisions alongside current results. That creates a feedback loop and lets the team assess its judgment, not only its campaign performance.
Consistency makes comparisons more credible. It also frees the team to spend its preparation time on the unusual results and difficult decisions that deserve attention.
10. 5 common QBR mistakes to avoid
- Overloading slides with data. Keep the main deck to decision-relevant evidence. Put the rest in an appendix.
- Skipping the narrative. AI can organize information, but a polished collection of metrics still needs a conclusion.
- Accepting AI analysis without validation. Check calculations, sources, attribution, and claims of causation.
- Making vague recommendations. "Optimize conversion" is a wish. Specify the action, owner, expected effect, and measurement plan.
- Confusing polish with substance. Good design helps stakeholders follow an argument. It won't make an unsupported argument correct.
Conclusion: Turn your QBR into a strategic advantage
The value of a marketing QBR is measured after the meeting. Did the team agree on priorities? Did it approve changes? Can it track whether those decisions worked?
A consistent structure makes those conversations possible. AI speeds up synthesis and initial drafts, while tools like Beautiful.ai reduce the manual work of building and refining on-brand slides.
The team still owns the judgment. That's where marketing leaders should spend the time AI gives back.
Create a Marketing QBR using beautiful.ai.



.avif)
.avif)
.avif)
.avif)
